|

IEEE 802.11p Vehicle to Infrastructure Communications in Urban Environments
The future deployment of cooperative vehicular services in urban environments, characterized by challenging propagation conditions, will require an efficient deployment of Road Side Units (RSUs). The work in:
J. Gozalvez, M. Sepulcre and R. Bauza, "IEEE 802.11p vehicle to infrastructure communications in urban environments", IEEE Communications Magazine, vol.50, no.5, pp.176-183, May 2012.
presents the results of an extensive field testing campaign aimed at analyzing the impact of urban characteristics, RSU deployment conditions, and communication settings on the quality of IEEE 802.11p Vehicle to Infrastructure (V2I) communications. The reported results show that the streets’ layout, urban environment, traffic density, presence of heavy vehicles, trees, and terrain elevation, have an effect on V2I communications, and should be taken into account to adequately deploy and configure urban RSUs.
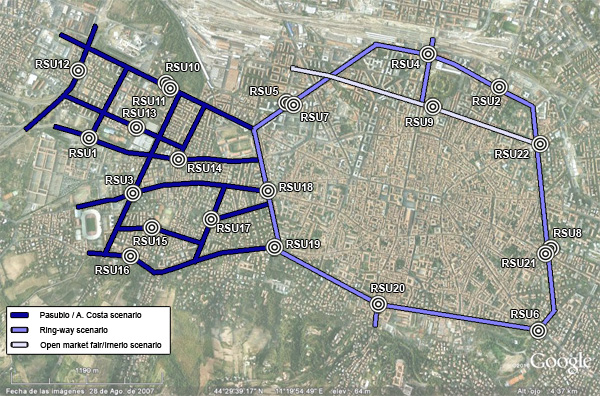
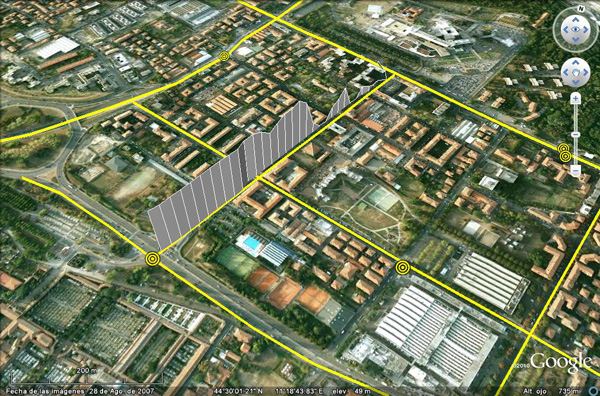
The field testing campaign has been conducted as part of the iTETRIS European research project, and focused on three urban scenarios: Pasubio / A. Costa, ring-way and Open Market Fair/Irnerio. The following figure depicts Bologna’s city centre, and identifies the three urban scenarios selected within the iTETRIS project. The figure also highlights the 20km of urban road network over which V2I radio measurements have been obtained during the field testing campaign. The campaign included 22 different RSU locations carefully selected to study the impact of various operating and propagation conditions on V2I communications. The campaign analyzed more than 70 RSU deployment configurations (combination of RSU location, transmission power, antenna height and type of mast). For each configuration, the OBU performed multiple test-drives to/from the RSU to provide valuable indications on the quality of V2I communications. More than 700 test-drives were conducted in total, with around 950km of testing distance traveled during more than 35 hours of wireless measurement tests being recorded.
This website provides access to additional graphic material about the performed field testing campaign in order to provide complementary information and facilitate the understanding of the urban and traffic conditions under which each test was conducted. Additionally, the complete PDR (Packet Delivery Ratio) curves for each of the conducted tests are also available. Finally, to enable further research based on the results of the conducted measurement campaing, the obtained GPS and IEEE 802.11p communication traces are available upon request.
In order to comply with our sponsor guidelines, we would appreciate if any publication using the graphical material, PDR figures, GPS or IEEE 802.11p traces reported in this website references the following publication:
J. Gozalvez, M. Sepulcre and R. Bauza, "IEEE 802.11p vehicle to infrastructure communications in urban environments", IEEE Communications Magazine, vol.50, no.5, pp.176-183, May 2012. |
To have access to the graphical material, PDR figures, GPS or IEEE 802.11p traces, please email j.gozalvez@umh.es and msepulcre@umh.es. For reference purposes, we would appreciate if in your email you indicate your name, affiliation, contact address and research activity for which you are planning to use our traces. If you are a student, please also include your supervisor's name and email address. You will receive an email with further instructions to download the graphical material, PDR figures, GPS or IEEE 802.11p traces in a few days.
Three different types of traces are available:
- Traffic traces basically include positioning, time, and speed information of the OBU so that they can be used for tasks related to traffic modeling and validation. Detailed information about the GPS coverage and estimated errors are also included. The information is updated at 10Hz.
- Communications traces basically include positioning information of both transmitter and receiver for each correctly received packet. The traces include also the RSSI level of such packets. These results represent the basis to calculate the communications performance traces.
- Communications performance traces include the packet delivery ratio (PDR) experienced at different distances to the RSU, computed based on averaging multiple runs. The traces include also geographic information so that the PDR can be geo-positioned.
The following tables detail the data available in each type of trace. The data is provided in plain text so they can be easyly read with Matlab/Octave or any other processing tool.
Traffic traces
| Column |
Description |
| UTC |
Universal Time Coordinated extracted from the GPS |
| LAT |
Latitude (in degrees) |
| LONG |
Longitude (in degrees) |
| Speed |
Speed of the vehicle (in km/h) |
| HEADING |
Driving direction (in degrees) |
| LAT_ERR |
Estimated latitude error extracted from the GPS (in meters) |
| LON_ERR |
Estimated longitude error extracted from the GPS (in meters) |
| NUMSATS |
Number of GPS satellites extracted from the GPS |
Communications traces
| Column |
Description |
| UTC |
Universal Time Coordinated extracted from the GPS |
| PktID |
ID of received packet |
| LOCALLAT |
Latitude of receiver node (in degrees) |
| LOCALLONG |
Longitude of receiver node (in degrees) |
| LOCALSpeed |
Speed of the receiver node (in km/h) |
| LOCALHEADING |
Driving direction of receiver node (in degrees) |
| REMOTEID |
ID of the transmitter node (ID=0 for the OBU) |
| REMOTELAT |
Latitude of transmitter node (in degrees) |
| REMOTELONG |
Longitude of transmitter node (in degrees) |
| REMOTESpeed |
Speed of the transmitter node (in km/h) |
| REMOTEHEADING |
Driving direction of transmitter node (in degrees) |
| V2IDistance |
Distance between transmitter and receiver |
| RSSI |
Received Signal Strength Indicator (in dBm) |
Communications performance traces
| Column |
Description |
| V2IDistance |
Distance between transmitter and receiver |
| PDR |
Packet Delivery Ratio |
| LAT |
Latitude (in degrees) |
| LONG |
Longitude (in degrees) |
An example of the PDR experienced in one of the conducted tests is presented in the following figure:
Insert the code provided by email to access the traces, the PDR curves and graphical material:
|